Scraping and Preparing College Basketball Team Stats

Building a reproducible pipeline to collect team performance data for college basketball analysis.
Introduction
In any analytics project, the first major hurdle isn’t the model—it’s the data. Reliable, up-to-date, and well-structured data is the foundation of meaningful insights. I built a Python script that scrapes and merges five statistical tables from Sports Reference: Basic Team Stats, Basic Opponent Stats, Advanced Team Stats, Advanced Opponent Stats, and Team Ratings.
This project was motivated by a simple but common need: researchers and students often want custom, ready-to-analyze basketball data, but the raw numbers live behind dynamic web tables that aren’t easily downloadable.
By automating this process, I created a tool that compiles all of these tables into a single, clean CSV file containing over 80 variables—ready for statistical modeling, visualization, or machine learning.
Motivating Question
How can we efficiently, reproducibly, and ethically collect and integrate college basketball team statistics from multiple Sports Reference pages into a single dataset for analysis?
Specifically, I wanted to:
- Build a pipeline that automatically pulls and merges team data from multiple tables.
- Ensure the process is transparent and ethical, respecting site limits and attribution.
- Produce a comprehensive dataset suitable for efficiency analysis, power rankings, and predictive modeling.
Ethics and Scraping Practices
Before scraping any site, it’s essential to confirm that your work follows both ethical and technical best practices. Here is how I approached this:
- Respecting robots.txt: Sports Reference allows scraping of public statistics pages for educational, non-commercial purposes.
- Rate limiting: The script makes only a few requests and runs once per session. It doesn’t spam or overload the site.
- Transparency: The code is public and reproducible in my GitHub repo.
- Attribution: Clear credit is given to Sports Reference as the original data source.
How the Data Is Gathered
The entire process runs through a single script, scraper.py. It’s lightweight, repeatable, and fully automated.
Setting the Season and URLs
The script automatically adjusts to the current NCAA season (for example, switching to 2026 when scraping in November 2025):
YEAR = today.year + 1 if today.month >= 11 else today.year

ratings_url = f'https://www.sports-reference.com/cbb/seasons/men/{YEAR}-ratings.html'
Five URLs are generated in this way — one for each of the team, opponent, and advanced stat tables, plus the team ratings page.
Requesting and Parsing the Data
Each page is fetched with requests and parsed using BeautifulSoup:
ratings_response = requests.get(ratings_url)
ratings_soup = BeautifulSoup(ratings_response.text, 'html.parser')
ratings_table = ratings_soup.find('table', {'id': 'ratings'})
Then the table is converted into a DataFrame with pandas.read_html(). This function does most of the heavy lifting—turning HTML tables into structured data with a single line of code.
Cleaning and Standardizing Columns
Each table uses slightly different column headers, so I standardized them for consistency:
advanced_stats_df = advanced_stats_df.rename(columns={
    'TS%': 'true_shooting_percentage',
    'ORtg': 'offensive_rating',
    'Pace': 'pace'
})
All columns are renamed to descriptive, machine-readable names (like offensive_rebound_percentage instead of ORB%), which makes future analysis and merging much easier.
Merging All Tables
After cleaning, the script merges all five DataFrames together by team name:
dfs = [opponent_advanced_stats_df, advanced_stats_df, opponent_basic_stats_df, basic_stats_df, ratings_df]
all_stats = reduce(lambda left, right: pd.merge(left, right, on="team_name", how="outer"), dfs)
This outer merge ensures that every team appears in the final dataset, even if one of the tables is missing certain stats.
To handle naming inconsistencies (like “Kansas” vs. “Kansas NCAA”), a helper field called team_base is used to prefer the clean, non-“NCAA” row. This step makes sure every team appears once, with the most complete version of its stats.
Saving the Final Dataset
Finally, the dataset is timestamped and saved as a CSV:
output_dir = BASE_DIR / f"data/{today}-team_stats.csv"
all_stats.to_csv(output_dir, index=False)
Each run generates a dated file, such as data/2025-11-09-team_stats.csv. This makes it easy to track how team stats evolve over time throughout the season.
EDA Highlights
Once the data was successfully scraped and merged, I ran a quick exploratory data analysis (EDA) to check its quality and uncover a few early insights.
This step is mostly about verifying that the merge worked correctly, ensuring column consistency, and exploring interesting patterns in team performance.
Basic Summary
- Teams scraped: 365 (all Division I programs)
- Variables: 84
- File generated:
{date}-team_stats.csv - Runtime: < 1 minute on average
- Coverage: Includes both basic and advanced team and opponent stats, plus ratings and schedule metrics
The final dataset is extremely comprehensive—each row represents one NCAA team and includes everything from shooting efficiency and pace to turnover rates and adjusted ratings.
Interesting Early Insights
Even a quick look at the numbers shows familiar basketball truths (and a few surprises):
- Teams with higher true shooting percentage (TS%) and assist percentage (AST%) tend to post stronger offensive ratings (ORtg).
- The simple rating system (SRS) correlates almost perfectly with both margin of victory (MOV) and net rating (NRtg) — confirming it’s a reliable single-number measure of team strength.
- Pace varies noticeably by conference: SEC and WCC schools generally play faster than Big Ten teams.
- A few teams stand out as defensive anomalies—they have average offensive numbers but elite opponent effective field goal percentages (eFG%), suggesting they win with defense.
Quick Visual
A quick visualization shows the efficiency relationship:
import matplotlib.pyplot as plt
import pandas as pd

df = pd.read_csv("data/{date}-team_stats.csv")

plt.scatter(df['true_shooting_percentage'], df['offensive_rating'])
plt.title("Offensive Rating vs True Shooting %")
plt.xlabel("True Shooting %")
plt.ylabel("Offensive Rating")
plt.show()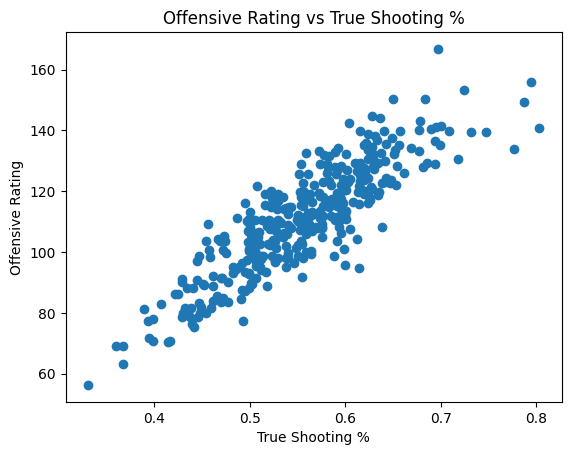
Further Information & Resources
For those interested in diving deeper into college basketball analytics or replicating this project, here are some useful resources:
Sports Reference: College Basketball — The official source for all scraped data, offering a rich collection of advanced and traditional basketball statistics.
Pandas Documentation — Essential for data cleaning, merging, and analysis in Python.
BeautifulSoup Documentation — Excellent for learning how to parse and extract information from HTML tables.
Code Repository
You can find the complete scraper code, README, and dataset outputs in my public GitHub Repository.
This repo includes:
- scraper.py: A Python script that scrapes basketball team data from Sports Reference and saves it in a .csv.
- requirements.txt: A list of Python packages required to run the data acquisition scripts.
- README.md: This file, providing an overview of the repository and its contents.
- data/: A directory where the acquired data files are stored.
- data/{date}-team_stats.csv: A csv file containing the team stats scraped from today’s date.
If you’re a fellow student or sports data enthusiast, feel free to fork the repo, explore the data, and adapt it for your own basketball analytics projects.
Conclusion
Data is the foundation of every good sports analytics project — and this scraper makes it possible to build that foundation automatically, reliably, and ethically. By combining five separate Sports Reference tables into one clean dataset, this project turns what used to be a tedious copy-and-paste task into a simple, reproducible data pipeline.
The resulting dataset captures nearly every aspect of team performance — from pace and shooting efficiency to rebounding, turnovers, and adjusted ratings.
Whether you want to compare conferences, build power rankings, or model tournament outcomes, this data provides the structure and depth to make that possible.
Acknowledgment
A special thanks to Sports Reference for maintaining one of the most comprehensive and publicly accessible basketball statistics databases on the web.
Their commitment to open, well-organized data makes projects like this one possible and helps students, researchers, and fans explore the game with data-driven insights.